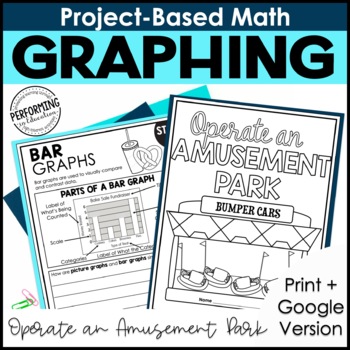

This 5-day project-based math resource applies math concepts in a real-world scenario to teach students about drawing scaled picture graphs and scaled bar graphs. In this 5-day unit, students will apply graphing concepts to create scaled picture and bar graphs and answer questions about the data in the graphs. This graphing math project is engaging and authentic. Plus, it’s available as both a digital and print resource.
This project-based math resource covers concepts of rounding and is aligned with the following 3rd Grade Math Common Core State Standards:
CCSS.MATH.CONTENT.3.MD.B.3
- Draw a scaled picture graph and a scaled bar graph to represent a data set with several categories. Solve one- and two-step “how many more” and “how many less” problems using information presented in scaled bar graphs.¬†For example, draw a bar graph in which each square in the bar graph might represent 5 pets.
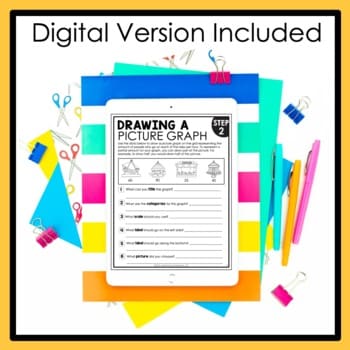
This resource is available in both Printable & Digital Google Slides versions.
What’s included in this resource:
- Background Knowledge: Using a KWL, students will build background knowledge around operating an amusement park.
- Graphing Review: Students will learn review graphing. The students will review non-scaled picture and bar graphs and label the different parts of a graph.
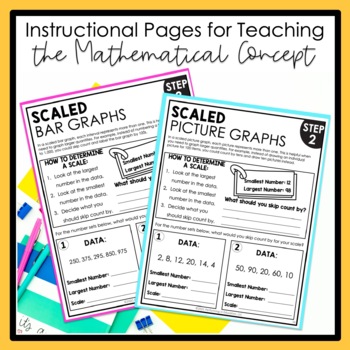
- Scaled Picture Graphs: Students will learn how to use scaling to create a scaled picture graph. The students will apply this concept to graph the number of people who go on various rides at the amusement park.
- Scaled Bar Graphs: Students will learn how to use scaling to draw a scaled bar graph. The students will apply this concept to graph the popularity of different concession stands and snack items at the amusement park.
- Using Polls to Generate Data: Students will learn how to create scaled graphs from poll data. Students will apply this concept to determine what park guests are most interested in and choose new items for their amusement park.
- Drawing Scaled Picture Graphs and Bar Graphs: Students will learn how to use what they have learned to compare their new additions to the original amusement park options.
- Wrap Up: Students will review their decisions for the park and use the data to determine if their decisions were successful.
***************************************************************************

Reviews
There are no reviews yet.