3.MD.B.3
MATH.CONTENT-Measurement & Data-Grade 3
Draw a scaled picture graph and a scaled bar graph to represent a data set with several categories. Solve one- and two-step “how many more” and “how many less” problems using information presented in scaled bar graphs. For example, draw a bar graph in which each square in the bar graph might represent 5 pets.
-
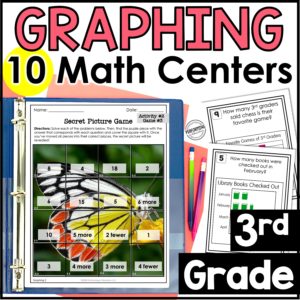
3rd Grade Math Centers | 10 Graphing Math Centers | Line Plots, Bar Graphs
$4.99 -
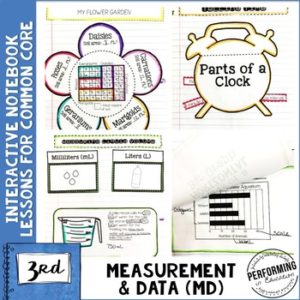
3rd Grade Math Interactive Notebook Measurement and Data MD
$6.00 -
Daily Math Spiral Review for 3rd Grade | Year-Long Math Practice
$19.00 -
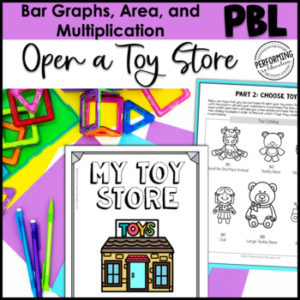
Math Project-based Learning for 3rd Grade: Open a Toy Store
$5.00 -
Math Project-Based Learning: Draw Picture Graphs & Bar Graphs | Data | 3rd Grade
$5.00 -
Sale!
Reading Test Prep, Writing Test Prep, & Math Test Prep | 3rd Grade Bundle
$23.00
